Sunday June 10, 2012
HK 388 : Monthly Cycle Charts
Monthly Cycle Directional Indicator :
113.7
- 145.9 - 155.6 - 155.6
- 170.9
- 182.7 - 185.2 - 199.8
- 245.5
The current subscription rate is US$400 per month for each pair or US$1,000 for 3 months. This would include daily, weekly and monthly cycle analyses. Contact Albert Cheung at qindex@gmail.com for details in payment or pay through PayPal system if you just order 1 or 2 items.
Monthly Cycle Projected Series : ... 148.1 - 153.9* - 159.6 - 162.5 // 165.4* - 168.3 - 171.1 - 174.0 -- 176.9* - 179.8 - [182.7] - 185.5 - 188.4* - 191.3 - 194.2 - 197.0 - 199.9* // 202.8 - 205.7 - 211.4* - 217.2 ...
Monthly Cycle Congested Area : 123.4 - 143.2 - (162.9 - 182.7) - 202.4 - 222.1 - 241.9
Normal Lower Limits : 148.1* - 155.2 - 156.9
Lower Mid-Point References : 165.4* - 170.2 - 178.4
Monthly Cycle Pivot Centers : 182.7* - 185.2 - 199.8
Upper Mid-Point References : 199.9* - 200.0 - 221.3
Normal Upper Limits : 215.2 - 217.2* - 242.7
![]()
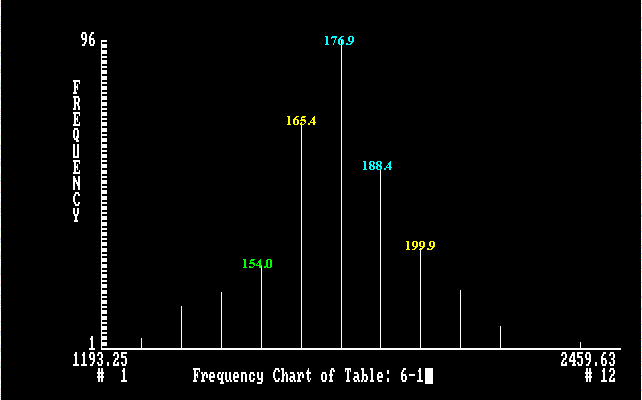
Monthly Cycle Frequency Chart of HK : 388
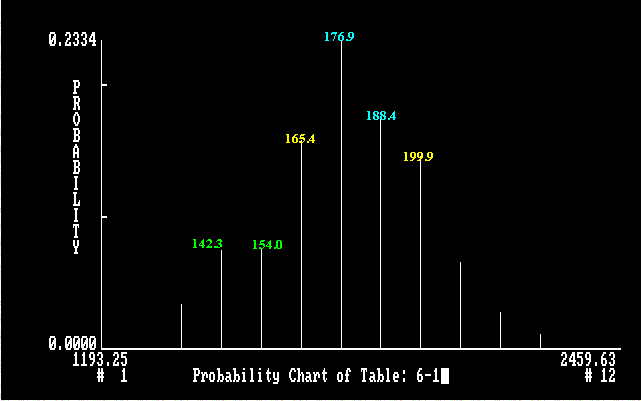
Monthly Cycle Probability Chart of HK : 388
![]()
Long Term References for Position Traders
Monthly Cycle Reference / Normal Lower Limits :
64.9 - 125.5 - 128.3 - 137.5 - 141.9 - 148.1 - 155.2 - 156.9
Monthly Cycle Reference / Normal Upper Limits :
163.6 - 169.4 - 173.7 - 215.2 - 217.2 - 226.9 - 242.7 - 276.9 - 365.4
Remarks : The lower and upper limits are good reference for the next three to six months. Significant levels are marked with stars. Those levels written in pink color are derived from the weekly cycle and the rest are obtained from the monthly cycle.
![]()
Trading Rules of QIndex
are as followings :
(1) The odds are in favor of maintaining a long position or a short
position when the market is trading above the weekly & monthly "Critical
Level" or below the weekly and monthly "Critical Levels" respectively. The
"Critical Levels" is located around the center of the projected profile.
(2) The market may trade in a range market when it is between the weekly
and monthly "Critical Levels. The center of the projected series are used
as a general direction references. A set of three curves are used in the
system to follow the market movement. The upper and lower barriers of the
projected series are significant supporting and resistant points.
(3) The market momentum is strong or weak when it is above the
upper barrier or below the lower barrier of the projected series
respectively.
(4) A strong trending market may have been established when the market is
able to trade either in the lower or upper limits of the current weekly
and monthly cycle projected series. In a strong trending market movement
recent monthly cycle limits are used as a general reference.
Projected
Series of
Hong Kong Exchange (HK : 388 - bigcharts.marketwatch.com) :
... 148.1 - 153.9* - 159.6 - 162.5 // 165.4* - 168.3 - 171.1 - 174.0 -- 176.9* - 179.8 - [182.7] - 185.5 - 188.4* - 191.3 - 194.2 - 197.0 - 199.9* // 202.8 - 205.7 - 211.4* - 217.2 ...
港交所三世書結構 (How to
Construct the Projected Series)
先由電腦計算出最低指示點
148.1元和最高指示點 217.2元,
將 148.1 元至217.2元這段分割為4大段.
( 148.1 - 165.4 - 182.7 - 199.9 - 217.2). 每段代表17.3元,
然後每一大段再分割為數小段, 以便觀察市場動態.
張氏量子分析法 ( Quantum Index Analysis )
http://www.qindex.com/hk388.html
Keys : (Graphs)
Blue = Resistant/Supporting Point within the Normal Trading Range
Green = Resistant/Supporting Point outside the Normal Trading Range
Yellow = Initial Upside/Downside Targeting Points which are also the Positions for the Lower / Upside barrier.
Keys (Projected Series)
All significant numbers are marked with a star "*" and they are interrelated and are separated from each other by a constant value or a multiple of the constant value.
The blue color represents the ends of a normal standard projected series and the lower and upper barrier of the projected series are marked with yellow and red colour together with the symbol xx.xx // xx.xx.
The center of the projected series is marked with pink color together with the symbol [xx.xx] and it is also the mid-point reference of two significant numbers.
Other mid-point reference of two significant numbers are marked with green color without a star.
The orange color is the mid-point reference between the significant number and the number marked with green color.
All rights reserved. I assume no responsibility for any error and am not liable for any damage that may result from the use of this information. The forecasts are based on quantum index analysis system that I have developed and may or may not predict the market movement accurately.